Covid-19 and Human Resources Dashboard in Power BI
Organizations worldwide are facing difficulties in comprehending the impact of the COVID-19 pandemic, and employers of all sizes are pondering over the safety of their workforce, particularly those who are most vulnerable to the virus.
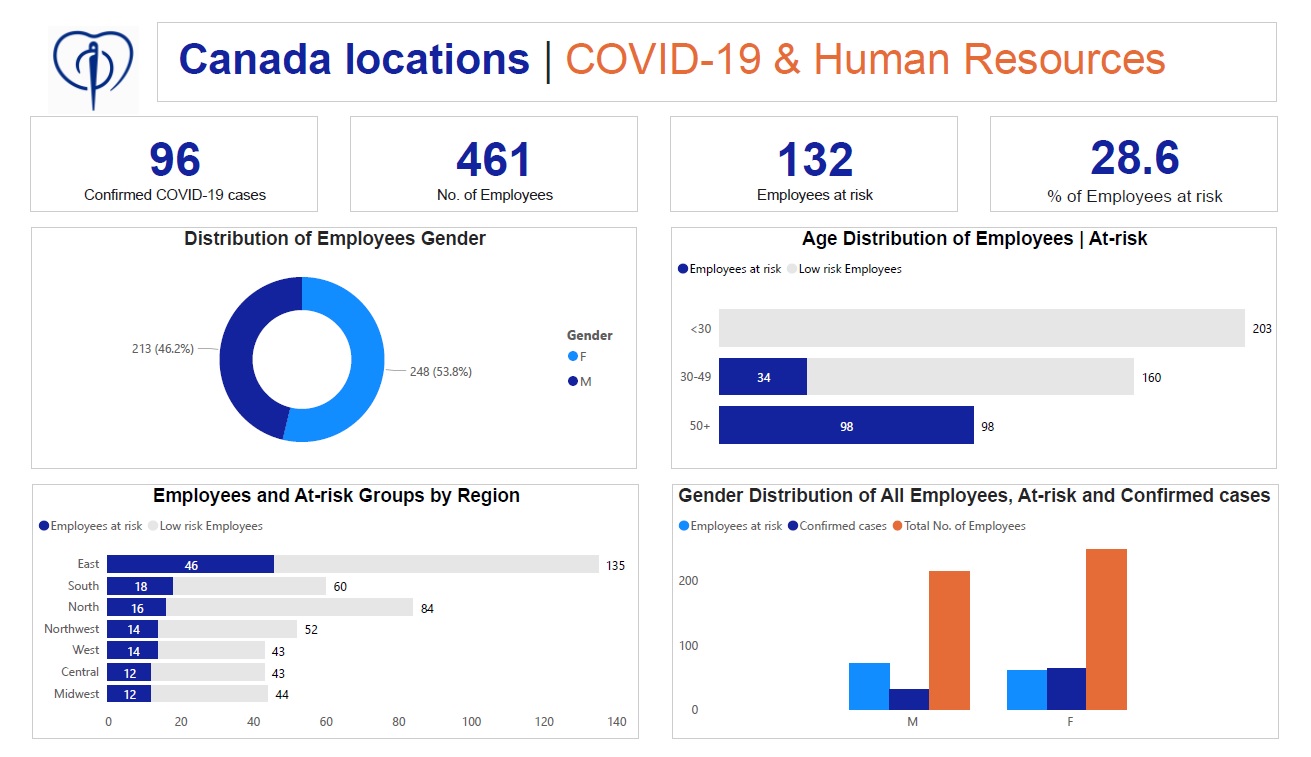
To address this concern, a sample project for a Canadian company expedited the development of an interactive and user-friendly COVID-19 & Human Resources dashboard. By merging data from the Our World in Data hub and a set of HR data, the dashboard provides an analysis of employees who are at risk based on their location, age, and gender.
This dashboard explored a Canadian company’s Coronavirus disease (Covid-19) data and analyzed at-risk employees by region, age group, and gender
TOOLS & TECHNOLOGIES USED
Power BI, Microsoft SQL, Ms Excel
OTHER PROJECTS
Campaign Success Analysis Presentation – EduShare
Power BI, PowerPoint
Covid-19 Global Numbers SQL Data Exploration in Microsoft SQL and Dashboard in Tableau
Microsoft SQL, Tableau
Performance Analysis Dashboard in
Power BI
Power BI, Microsoft SQL
California Housing Prices
Python, Jupyter Notebook, Kaggle