Performance Analysis Dashboard in
Power BI
BUSINESS CHALLENGE
ABC insurance company requested performance analysis of their health plans over a six-month period.
TOOLS & TECHNOLOGIES USED
Power BI, Microsoft SQL
GOALS
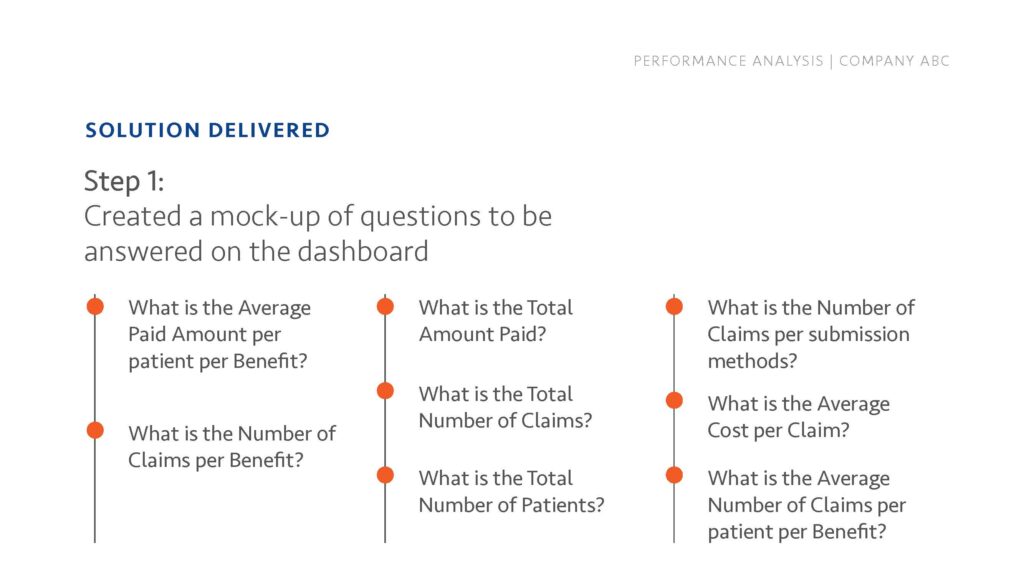
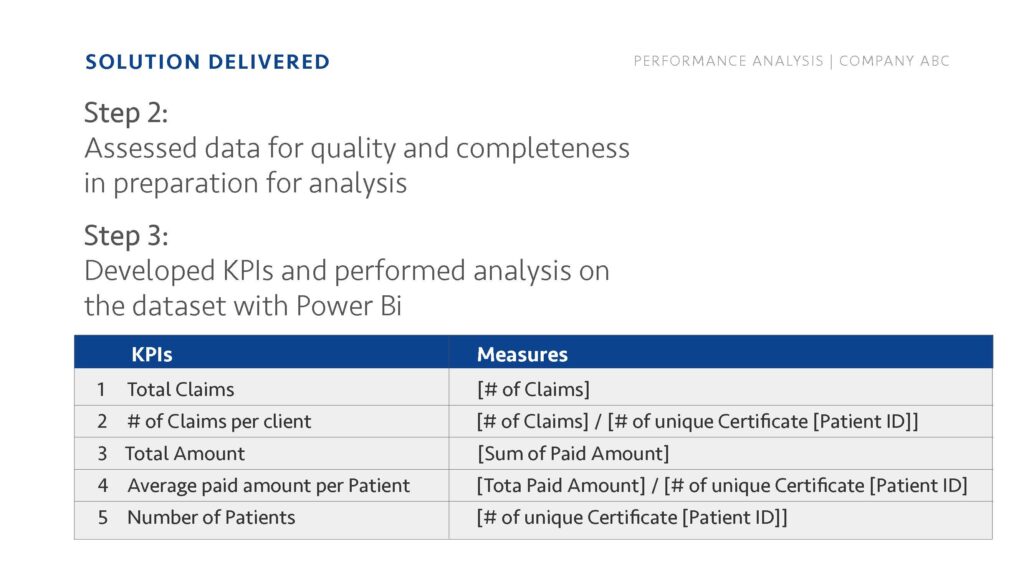
To develop a visualization dashboard with insightful KPI metrics
OBJECTIVES
- To provide insights that can minimize losses from claims
- To improve claims strategies
- To provide clarity for business executives so they can make the best business decisions
BUSINESS INSIGHTS
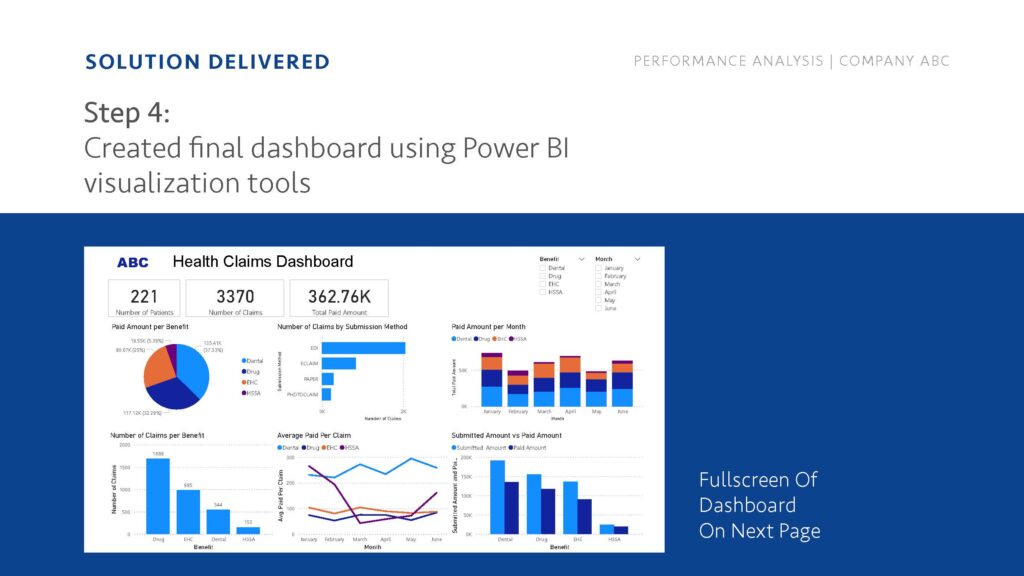
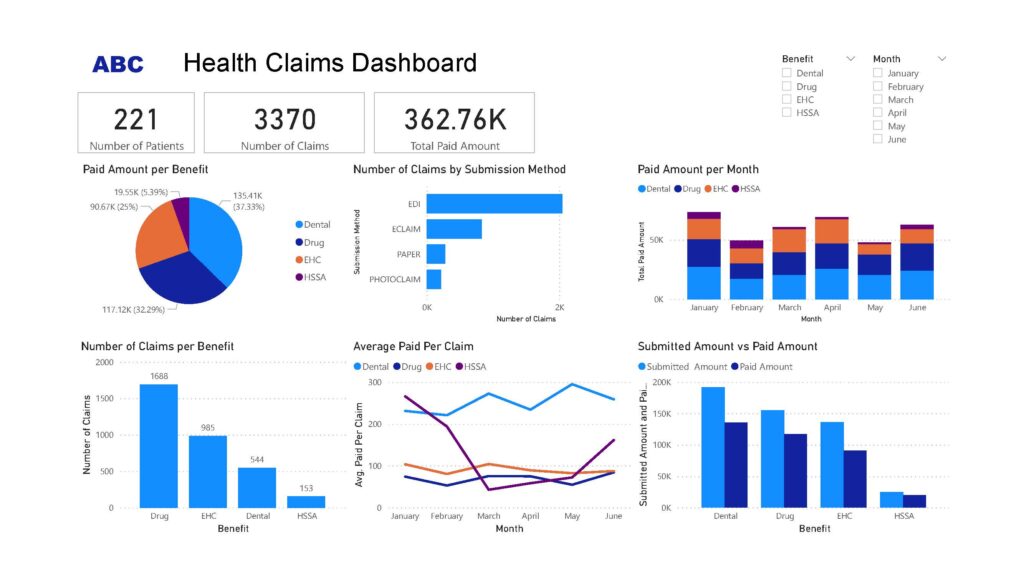
- Drug benefit has the highest number of claims (about 50%) of the total number of claims while Dental benefit contributed to about 16%. However, the largest amount paid was for Dental benefit (about 37%).
This shows that Dental coverage is more expensive. - Majority of the claims were submitted via EDI method (about 61%). EDI submission method has shown to minimize disruptions of cash flow and ensure claims are processed more quickly and payment made faster.
- There was a drastic drop in the Average amount paid for HSSA benefit between January and March which is not consistent with the rest of the plans
FEATURED PROJECTS
Top 25 Drugs Analysis
Power BI, SQL
Report Automation for Health Claims Adjudication
Python, SQL, Excel
Campaign Success Analysis Presentation – EduShare
Power BI, PowerPoint
California Housing Prices
Python, Jupyter Notebook, Kaggle