Covid-19 Global Numbers SQL Data Exploration in Microsoft SQL and Dashboard in Tableau
The 2019 Novel Coronavirus came at a time when the world was eager for a unique year 2020, some hoping it brings good tidings, some saying it’s a lucky number. Before the end of the first quarter in 2020, the WHO declared COVID-19 a pandemic.
The effect of this in our world is massive; infection rates and deaths increasing daily, people losing loved ones, panic buying of food and essential home items, social distancing and loss of jobs. The pandemic is definitely one that this generation will not forget anytime soon
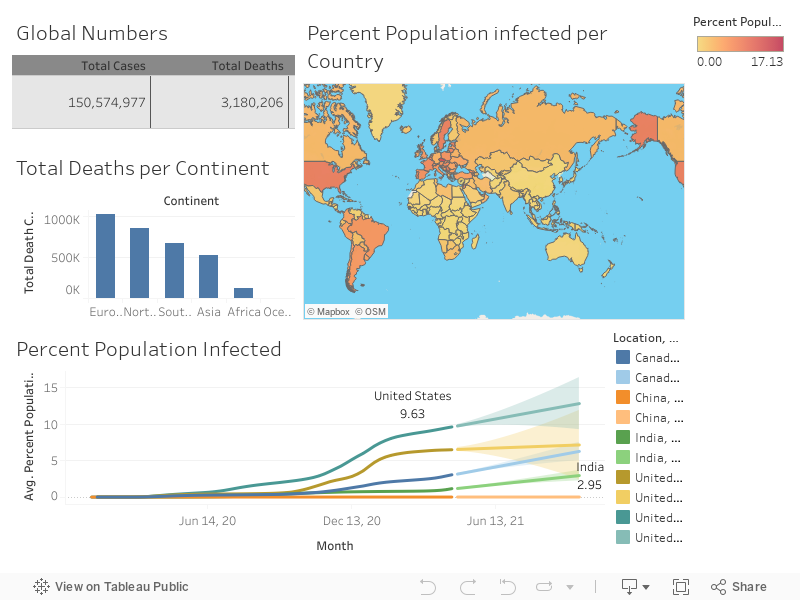
In order to put the numbers into better perspective visually, this dashboard was created to provide information on the recent developments of COVID-19 globally using the COVID-19 dataset over a period of 16 months from Our world in data hub (https://ourworldindata.org website).
TOOLS & TECHNOLOGIES USED
Microsoft SQL, Tableau
Dashboard Narrative
These figures give insight into what is ongoing in our world, and also a forecast of how things will be.
But with the introduction of vaccinations, it is expected and people are beyond hopeful that this virus will be curbed, sooner.
SQL Query
OTHER PROJECTS
Campaign Success Analysis Presentation – EduShare
Power BI, PowerPoint
Performance Analysis Dashboard in
Power BI
Power BI, Microsoft SQL
California Housing Prices
Python, Jupyter Notebook, Kaggle
Covid-19 and Human Resources Dashboard in Power BI
Power BI, Microsoft SQL, Excel