HR Dashboard
BUSINESS CHALLENGE
As talent becomes a scarce commodity, organizations are now applying analytics to their people data. In this project, the Human Resources Department of a multi-national business needs a dashboard to give them insight on the company’s human resources. The HR department wants to track some KPIs such as Gender diversity (M/F), Full time employee vs Contractor ratio, Employee Age diversity, No of active employees per month, Active employees by Ethnic group, Active Employee by Regions, Employee Tenure, etc.
For the project, we have csv files, by the HR department containing information about Company employees.
The goal of the project is to design an interactive HR dashboard in Excel
TOOLS & TECHNOLOGIES USED
Excel Power Query, DAX, Power Pivot
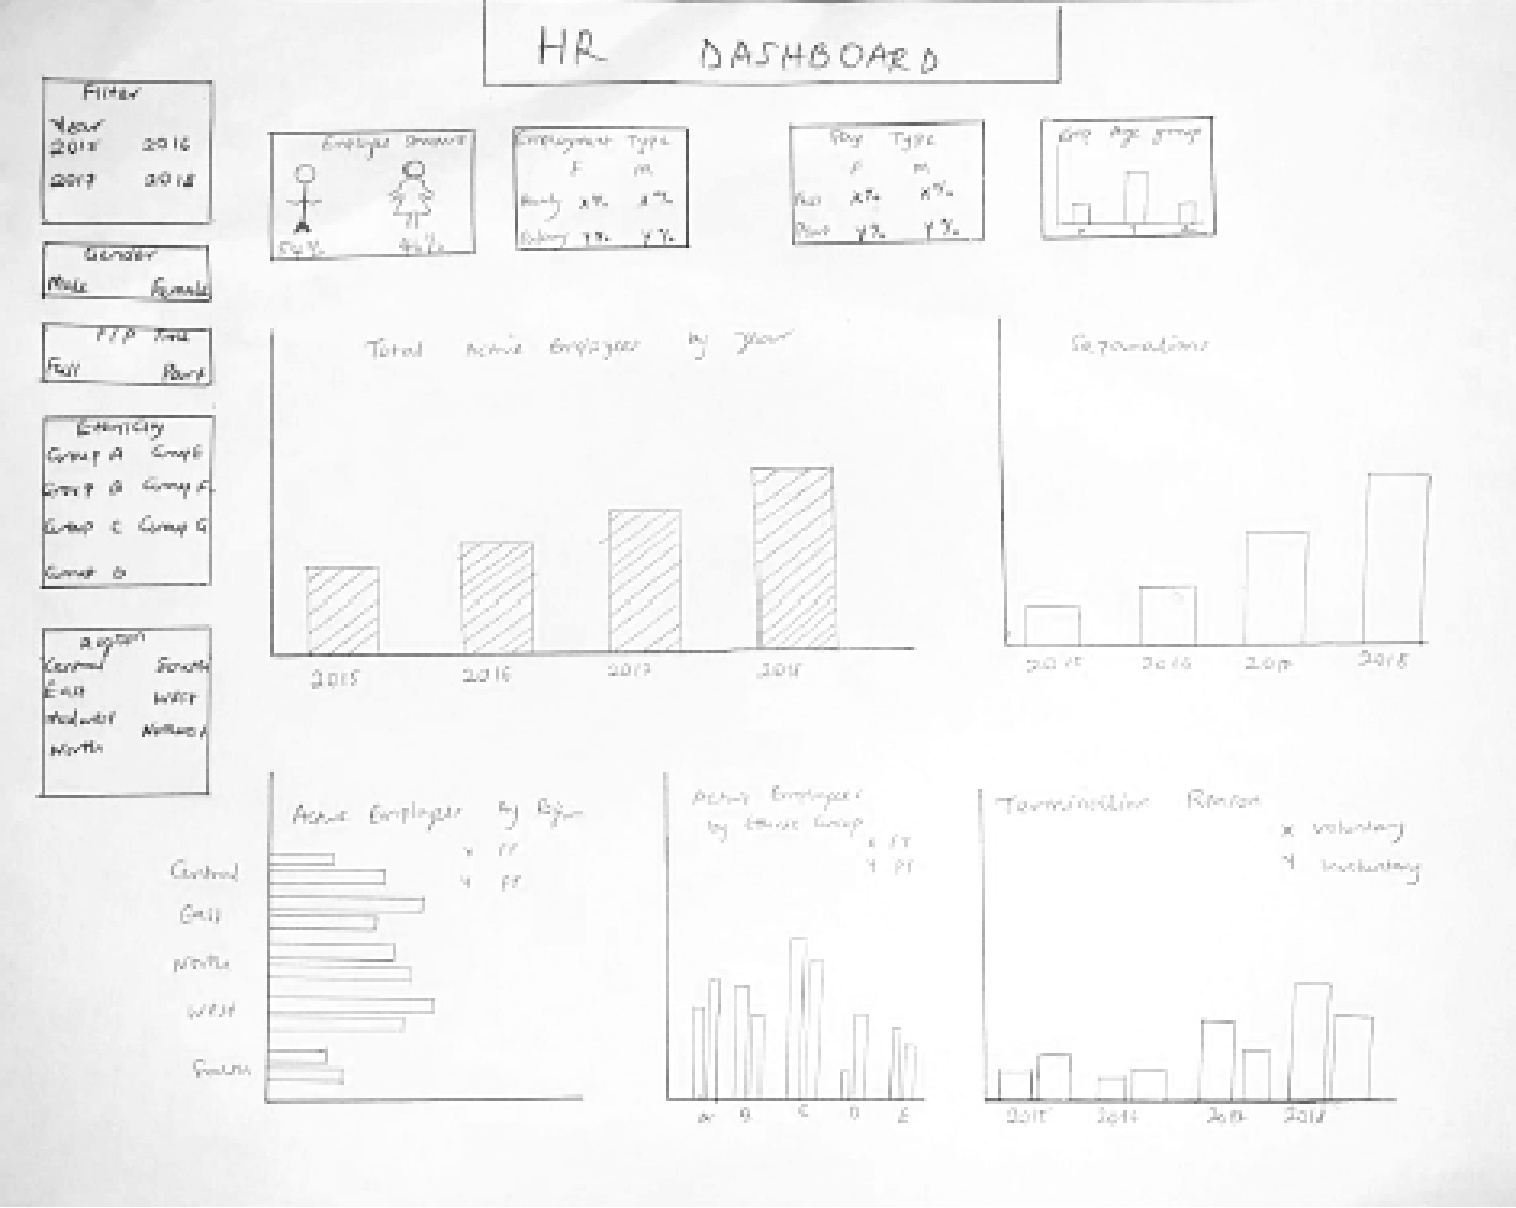
STEP 1
A mock-up of the various charts to use on the KPI is created
STEP 2
Created final dashboard using Excel

FEATURED PROJECTS
Covid-19 Global Numbers SQL Data Exploration in Microsoft SQL and Dashboard in Tableau
Microsoft SQL, Tableau
Performance Analysis Dashboard in
Power BI
Power BI, Microsoft SQL
Covid-19 and Human Resources Dashboard in Power BI
Power BI, Microsoft SQL, Excel
Maven Market Grocery Business Dashboard
Power BI