Maven Market Sales Dashboard
BUSINESS CHALLENGE
A multi-national grocery chain business, called Maven Market, with locations in Canada, Mexico, and the United States needed a KPI dashboard for their sales departments to be able to track their business sales, revenues, profits, and returns. They equally want to be able to compare regional performance, analyze product-level trends and forecasts, and identify high-value customers.
For the project, we have csv files containing information about business transactions, returns, products, customers, calendar and regions and stores.
TOOLS & TECHNOLOGIES USED
Power BI
SOLUTION DELIVERED
An end-to-end business solution was delivered to the business.
Here are the steps taken in delivering the solution.
STEP 1
Identified the KPIs that we want to track in the dashboard. These include:
- Total Revenue
- Monthly Revenue
- Actual vs Targeted Revenue
- Top 2 Products per region
STEP 2
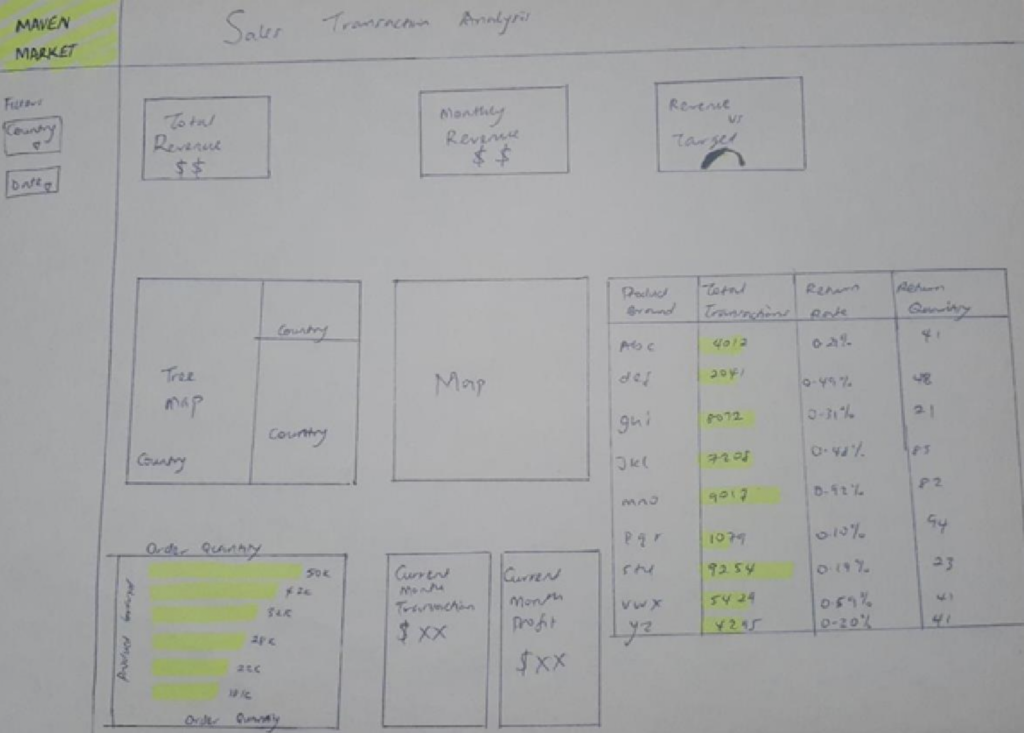
A mock-up of the various charts to use on the KPI is created
<see screenshot>
STEP 3
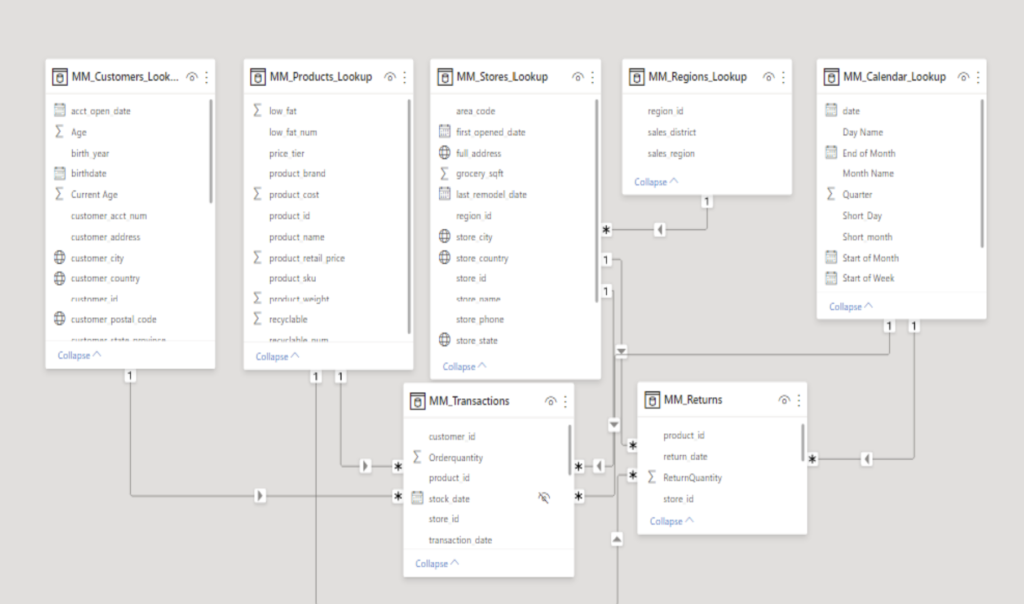
Data Model created in PowerBI to connect the data and define relationship
<see screenshot>
STEP 4
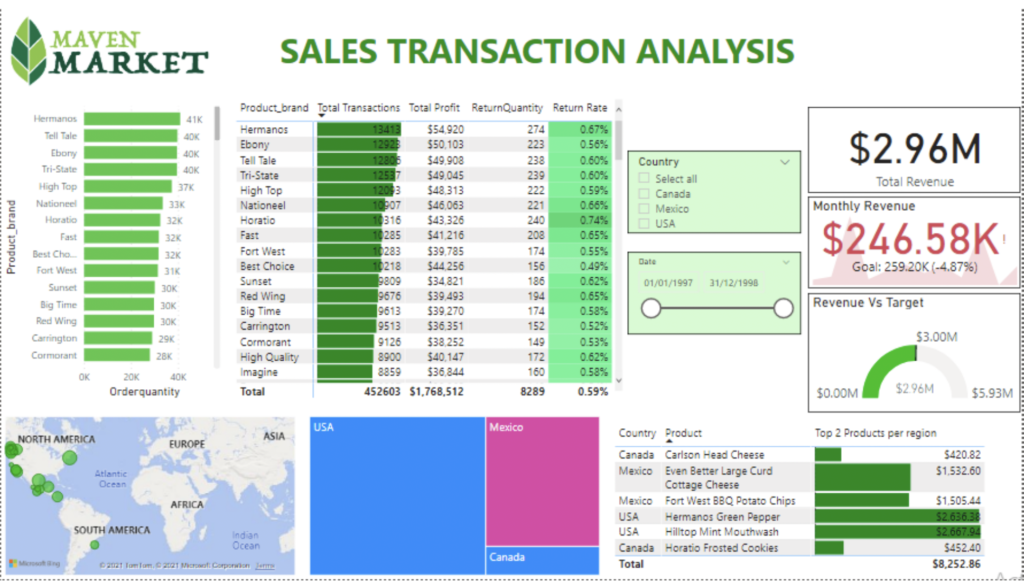
Created final dashboard using PowerBI visualization tools.
<see screenshot>
BUSINESS IMPACT
- Provides Maven Market some insights that highlight some hidden sales trend and performance
- Leads to reduction in time for business executives in making sales strategy decisions
- Shows the business sales performances and progress all in one place
- Highlights areas of opportunity for sales logistic and process improvement by the business
FEATURED PROJECTS
Covid-19 Global Numbers SQL Data Exploration in Microsoft SQL and Dashboard in Tableau
Microsoft SQL, Tableau
Performance Analysis Dashboard in
Power BI
Power BI, Microsoft SQL
Covid-19 and Human Resources Dashboard in Power BI
Power BI, Microsoft SQL, Excel
HR Dashboard
Excel Power Query, DAX, Power Pivot